Research interests
My primary research interest spans two areas, second language acquisition (SLA) and corpus linguistics: One of the goals of my research agenda so far has been to bring the two areas together. I am particularly interested in systematicity and individuality in second language (L2) development. To characterize language development at the level of individual learners, it is essential to target a large number of learners, and for this reason, my work often draws on large-scale learner corpora. Furthermore, in order to gain insights from such corpora, I have employed a variety of statistical and computational techniques. Below, I explain my research under three themes: SLA, corpus linguistics, and quantitative data analysis.
SLA research based on learner corpora
I did a series of studies to disentangle universality, systematicity, and individuality in the L2 development of English grammatical morphemes. More specifically, I observed their cross-sectional and longitudinal accuracy development, and quantified native language (L1) influence (i.e., systematicity) as well as individual variation (i.e., individuality).
My paper in Studies in Second Language Acquisition [link, preprint] challenged the long-held belief in SLA that the acquisition order of English grammatical morphemes is universal, irrespective of learners’ L1. Data drawn from the Cambridge Learner Corpus showed strong L1 influence on the accuracy order of grammatical morphemes. The table below demonstrates the accuracy order of six English grammatical morphemes across seven L1 groups at the B2 level in CEFR. We can for example see that articles tend to be ranked low in L1 Japanese, Korean, Russian, and Turkish learners, while they tend to be ranked high in the other L1 groups. What has been believed to be universal, therefore, was shown to be just systematic.
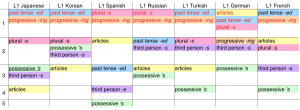
The table shows the accuracy order of L2 English grammatical morphemes at the B2 level. Morphemes in Cluster 1 marked higher accuracy (TLU) scores than those in Cluster 2, which in turn scored higher than those in Cluster 3, and so forth. For example, in the L1 Turkish group, past tense -ed and progressive -ing received the highest accuracy scores, followed by plural -s and third person -s with similar accuracy levels. These were, in turn, followed by articles, with possessive ’s as the least accurate morpheme. I clustered in the highest rank all morphemes with accuracy scores above 0.90 at p < .05 (marked by red font) and any morphemes with lower scores but not statistically significantly lower. Underlined morphemes did not show a significant difference with any other morpheme. Such morphemes were clustered together with morphemes of closest accuracy.
The study further demonstrated that some morphemes are more sensitive to L1 influence than others. Articles, for instance, were more strongly affected by L1 than plural -s, which in turn was more sensitive than third person -s. The finding was partially interpreted under the framework of thinking for speaking proposed by Dan Slobin. Under the framework, morphemes encoding language-independent concepts (e.g., number, which is a concept that even those whose L1s do not encode number regularly attend to) are less strongly affected than those encoding language-dependent concepts (e.g., definiteness, which is a concept that those who speak article-less languages as their L1s rarely attend to). The finding was replicated with another learner corpus, and the replication was reported in Chapter 3 of my PhD thesis [link]. The figure below shows that the relationship between morphemes with respect to the degree to which they are influenced by L1 are similar across the two learner corpora, with a possible exception of progressive -ing.
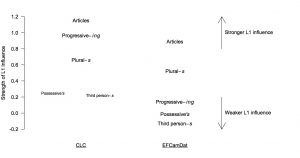
The figure illustrates the strength of L1 influence in the CLC and in EFCAMDAT. The higher a morpheme is located, the more sensitive it is to L1 influence. The value of 0.0 represents the absence of L1 influence.
Since the above study was cross-sectional in nature, it was not able to track the longitudinal development of individual learners. Therefore, in another study, published in Language Learning [link, preprint], I exploited EF-Cambridge Open Language Database (EFCAMDAT), a longitudinal learner corpus, to track individual learners and observe their longitudinal developmental patterns. More specifically, I modeled morpheme accuracy as a function of several factors including learners’ L1 and proficiency. Based on the model, I examined what influences the developmental pattern and also quantified individual variation. The results showed that, while the L1 affects learning curves, individual variation in the curves is larger, and that the accuracy difference between individual learners is larger than L1 influence. The figure below shows the model-based development of article accuracy in individual learners. It is clear that the magnitude of individual variation in the lower panels is much larger than the effect of L1 type (i.e., PRESENT vs ABSENT, encoding whether the learner’s L1 has an equivalent feature to the English article). I believe that this is the first study that quantified individual variation in L2 development.
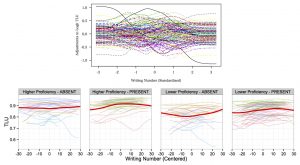
The figure shows individual variation in the longitudinal development of article accuracy. The upper panel represents adjustments to accuracy scores for individual learners across standardized writing numbers. If there were no individual variation within each L1 type, morpheme, and proficiency level, all of the lines should completely overlap. As we can see, however, large individual variation is present both in terms of absolute accuracy and developmental shape. The bottom four panels show the fitted values of article accuracy in individual learners divided into two proficiency groups (higher vs. lower) and two L1 types (ABSENT vs. PRESENT). The cut-off proficiency level for the two proficiency groups was learners’ mean proficiency. The thick lines in each panel are locally weighted scatterplot smoothing lines (LOESS) showing the overall trend.
The above study demonstrated large individual variation in developmental patterns. It, however, does not mean that the longitudinal developmental pattern of individual learners is random. In the study that is going to be published in the proceedings volume of CogSci 2016, I identified regularities in the patterns by statistically clustering learners according to their learning curves of articles, which resulted in three groups of learners with different learning curves. Interestingly, these three patterns would have been hidden if I had only looked at the averaged learning curve of all the learners (see the figure below). This indicates that we cannot properly infer the developmental pattern of individual learners based on their averaged pattern.
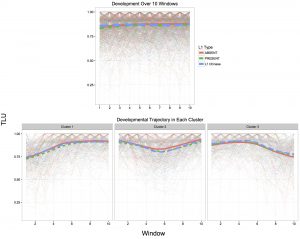
The figure demonstrates the accuracy development of individual learners across Englishtown teaching levels. Englishtown levels 1-16 are shown on the horizontal axis and accuracy is on the vertical axis. In the figure, each thin line represents the accuracy development of one learner, and thick lines are LOESS trend lines. Solid, dashed, and dotted lines correspond to the development of the ABSENT, the PRESENT, and the L1 Chinese groups respectively. L1 Chinese was separated because visual inspection (not shown) suggested that they behave differently from the other ABSENT groups, and there are indeed studies claiming that Mandarin-Chinese has linguistic features that play similar roles to English definite (Huang, 1999) and indefinite (Chen, 2004) articles. The figure demonstrates the discrepancy between the averaged developmental pattern (the upper panel) and the developmental pattern of clustered individual learners (the bottom panels).
While above studies have exclusively focused on accuracy development, I have more recently started working on the L2 development of linguistic complexity, another important dimension of L2 proficiency. Based on EFCAMDAT, I so far have demonstrated that sentential complexity (as measured by mean sentence length) and lexical complexity (as measured by a measure of textual lexical density, MTLD) better discriminate learners with higher and lower proficiency than the accuracy of grammatical morphemes. For instance, the figure below shows that MTLD discriminates learners if their proficiency difference is large (e.g., Proficiency Levels 1 vs 9, or Proficiency Levels 6 vs 13), whereas article accuracy only sporadically discriminates learners, and even when it does, it does not discriminate learners with large proficiency differences.
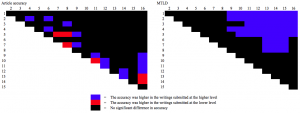
The figure demonstrates the results of pairwise comparison of article accuracy (left) and MTLD between 16 proficiency levels. Axis numbers indicate proficiency levels, and the upper right triangles indicate the results of pairwise comparison. Blue cells represent the proficiency pairs where the higher proficiency group marked a statistically significantly higher accuracy or complexity value than the lower proficiency group. Red cells represent the reverse cases, where higher proficiency group marked a lower accuracy or complexity value than the lower proficiency group. Black cells represent the cases where no significant difference was observed between the proficiency pair.
Corpus linguistics
In addition to learner corpus research, I am also interested in quantitative exploration of large-scale corpora in general. I have carried out corpus-based comparison of English textbooks among Asian countries and also investigated the characteristics of interdisciplinary research discourse. Both projects employed Douglas Biber’s multidimensional (MD) analysis. In the former study [link], I wrote my own Perl scripts to count the frequency of various linguistic features in an English textbook corpus, while in the latter project which was funded by ESRC, we collaborated with Doug Biber, who conducted the data retrieval and much part of the statistical analysis.
The MD analysis in the latter study, which exploited a corpus consisting of research papers, identified stylistic differences between journals. When we clustered individual research papers according to the ‘dimension scores’ that linguistically characterise each paper, we could see that papers from the same journal tended to cluster together. This is shown in the figure below. The figure also demonstrates that some journals tended to cut across clusters, which means that while journals distinguish dimension scores to a certain extent, there is considerable variation within each journal as well.
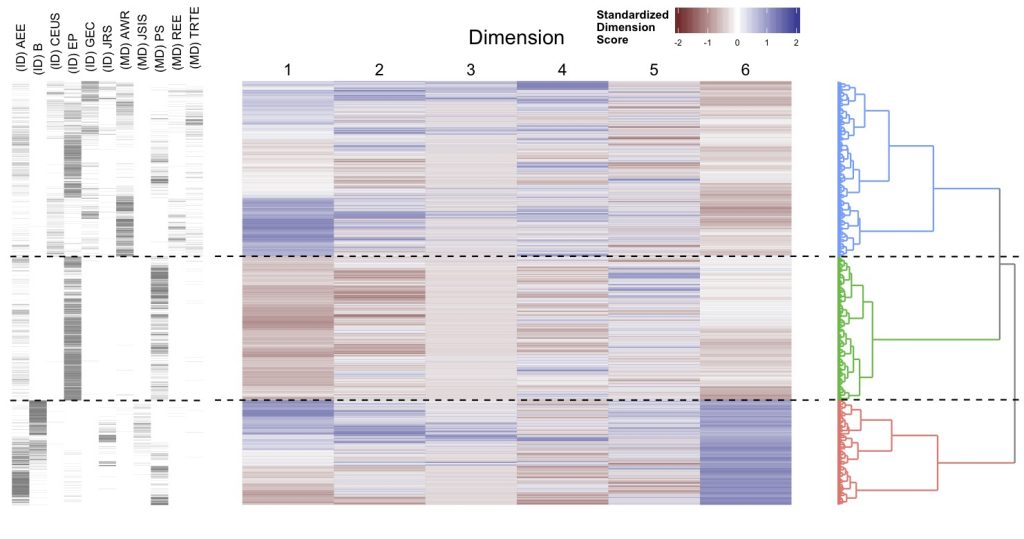
The figure shows the clustering of research papers according to their dimension scores. There are 11,201 rows in the figure, each corresponding to a paper. The leftmost panel shows the journal the paper was published in. The middle heatmap displays the standardized dimension score of each paper. The rightmost panel is the dendrogram of a hierarchical cluster analysis. It appears that the three-cluster solution is appropriate as there is relatively a large gap between the second and the third division from the root. Assuming three clusters, dashed lines were drawn between clusters.
Based on the multidimensional analysis, we further clustered individual research papers of a single journal into the groups sharing similar textual characteristics. What we found was that each journal has a distinct profile of discourse, and yet there are still different types of papers within a journal. A paper reporting our findings based on the multidimensional analysis will be published in International Journal of Corpus Linguistics.
Another computational technique we employed in the the investigation of interdisciplinary research discourse was topic modeling, which is a novel approach to identify topics automatically in a given corpus and has been in rapid development in machine learning and computational linguistics. Exploiting a topic model, we (i) investigated the topic transition within papers (e.g., topics on the overview and contextualization of papers were more prominent at the beginning of the papers than at the end), (ii) examined the chronological change of topics in a journal (e.g., topics relevant to agenda setting were more prominent in the early years of the journal than in later years), (iii) identified different types of papers with different topical structure (e.g., a paper that includes multiple topics vs a paper that is thoroughly concerned with a single topic), and (iv) disambiguated the senses of polysemous words (e.g., “level” referring to the degree of concentration, as in “the level of CO2 concentration” vs the same word use to refer to height, as in “sea level”).
For instance, the figure below shows topic distribution in text-blocks, papers, and words. Panel A shows that different topics are prominent in different textbooks, and that while some text-blocks have one very prominent topic and the other topics are weak (e.g., Topic 37 in the final panel), others have multiple prominent topics (e.g., Topics 1, 22, and 25 in the second panel). Panel B shows topic distribution at the level of papers. Here, we chose four papers that have Topic 10 as the most prominent topic. The top 10 keywords of Topic 10 are as follows: water, river, basin, suppli, flow, irrig, resourc, avail, use, and stress. The topic can justifiably be summarized as ‘water’, and indeed, the titles of the four papers (not shown here) signal that water is their main topic. Based on Panel C, we can tell that topic probability for any given word is highly skewed: A word has a few prominent topics at most and has negligible probability for most of the topics. The word polici (policy), for instance, is highly probable in Topic 36 (Environmental policy actors, makers) but is practically absent in the other topics. Although still skewed, some words have decent probability in multiple topics. For the word area, a fair amount of probability mass is allocated to Topics 19 (Forestry management), 23 (Wetlands, coastal, flooding), and 39 (About ecosystems and biodiversity). This means that the word is relatively frequent in the three topics compared to the other topics. The figure also shows that individual topics are characterized by just a few keywords. Topic 3 (Emission regulations), for example, includes a high frequency of carbon, emiss (emission), greenhous (greenhouse), and level, but not other words. Thus, these are the distinctive keywords of the topic. In this manner, topic models link topics and their keywords. We wrote a paper introducing the technique to corpus linguists, which will be published in Corpora in 2017.
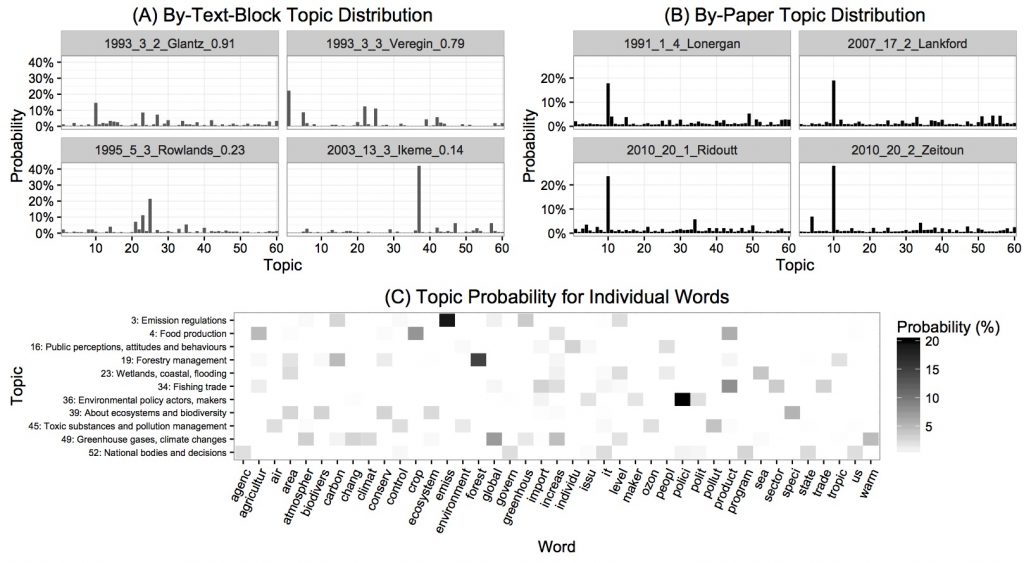
The figure demonstrates topic distribution in some of the text-blocks and papers. The horizontal axis represents 60 topics and the vertical axis represents the corresponding probability in each text-block (A) or paper (B). Panel C visualizes the topic probability of individual words in a selection of the topics. Each row represents a topic with its interpretative label as given on the left. The shading in each cell indicates probability, with a darker shade corresponding to higher probability.
Quantitative data analysis
Corpora provide us with a rich empirical basis of language research, but since corpus data are often less controlled and thus noisier than experimental data, we need rigorous analytical techniques to disentangle signal from noise. For this purpose, I have pursued the use of sophisticated data analytic techniques in corpus-based research, and have disseminated what I learned to SLA researchers and corpus linguists.
The aforementioned paper on topic models primarily aimed to introduce the use of the technique to corpus linguists. In addition to the issues mentioned earlier, the paper compared topic models to more traditional techniques in corpus linguistics, including semantic tagging and keywords analysis, and empirically demonstrated the pros and cons of topic models in comparison to the techniques. The topic model is an innovative data-driven technique to explore a corpus without imposing much assumption, and I believe it will be increasingly used in corpus linguistics.
In terms of the analytical aspect of SLA research, my paper in Language Learning [link, preprint] intended to introduce to the SLA community two statistical modeling techniques that allow researchers to analyze systematicity, individual variation, and nonlinearity in L2 development. Generalized linear mixed-effects models (GLMMs) can be used to quantify individual variation and examine systematic effects simultaneously, and generalized additive mixed models (GAMMs) allow for the examination of systematicity, individuality, and nonlinearity within a single model. The paper discussed the strengths of each technique and the ways in which these techniques can benefit L2 acquisition research, further highlighting the importance of accounting for individual variation in modeling L2 development. The figure below illustrates the last point. It shows the predicted developmental patterns of article accuracy across different models. The point of the figure is the magnitude of uncertainty represented by the width of shaded 95% confidence intervals, which are clearly wider in the GLMM and the GAMM panels than in the GLM and the GAM panels. The wider confidence intervals of the GLMM and GAMM are brought about by their ability to account for individual variation. This means that if we do not control for individual variation, we may obtain spurious ‘significant’ results.
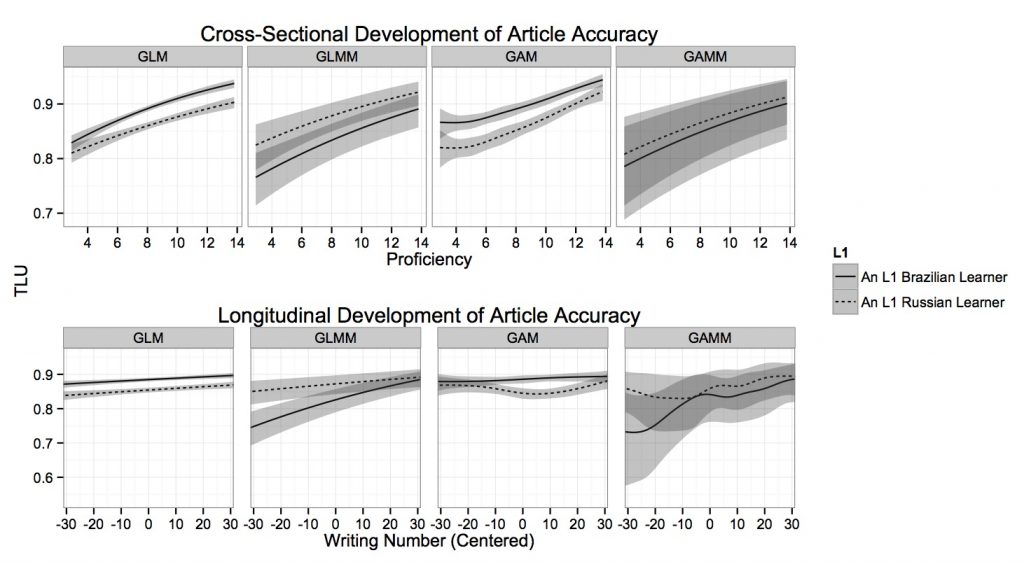
The figure demonstrates the cross-sectional and longitudinal development of article accuracy across different types of models for different L1 types. It shows the predicted development of two learners, one L1 Russian and one L1 Brazilian, who contributed the largest number of error-tagged writings among the ABSENT and PRESENT learners, respectively. GLM = generalized linear model; GAM = generalized additive model.
I have been a heavy user of R for some time, and have relied on it in the retrieval, analysis, and communication of quantitative data. I have found packages developed by Hadley Wickham quite useful (e.g., ggplot2, dplyr, tidyr, stringr, readr).
I am in support of the open science movement, and have made the R codes and data used in my Language Learning paper publicly available through Open Science Framework [link].
(last updated: 10 June, 2016)